Thursday, May 9, 2013

Acid Base Titration Lab

Titration Lab

Materials:
-Mac
-Vernier Computer Interface
-LoggerPro
-Vernier pH senso
-HCL Solution, unknown Concentration
-0.100 M NaOH Solution
-Magnetic Stirrer
-Stirring Bar
-Wash Bottle
-50-mL buret
-Ring Stand
-2 Utility Clamps
-10-mL pipet
-Pipet Pump
-250-mL beaker
-Distilled water

The picture below is the whole reason why we did this experiment. As we slowly added NaOH (a base) to hydrochloric acid (a acid) We watched to see the exact point when the acid changed to a base. As you can see from this graph and the list of levels to the left, it was after we added about 16 mL of NaOH. It was really interesting to watch the sudden change in pH levels that occurred after we added just the right amount of base.
        In this lab the equivalence point was 16 mL because that was the point that the pH level started to rise to a point that would classify the solution as a base instead of an acid.
Mr. Ludwig introduced me to this little equation to help me discover the concentration of the acid.
It is:
M1V1=M2V2
Basically what that means is that the concentration of the base (NaOH) multiplied by the Volume of NaOH that we slowly added is equal to the concentration of the acid (HCL)  multiplied by the Volume of the Acid we used.
After doing the math I came up with 1.6x10^-5 for the concentration of the acid.

Crystal Lab and Finding Concentrations

These last couple of weeks we have done A LOT of labs in Chemistry. First is the Crystal Lab...this was a fun lab because we got to do a lot of trial and error in making perfect crystals.


The second lab I am including in this post is the Concentration Lab. Also called the Beer's Lab.

What we used:
Macbook
Vernier Computer Interface
Logger Pro
Vernier Colorimeter
One cuvette
Test Tubes
Tissues
Stirring Rod
30 mL of .40 M NiSO4
5 mL of NiSO4 Unknown solution
Pipet and Pipet Pump
Distilled Water
Test tube Rack
Beakers

What we did:
1. We set up our work station and pulled up the correct LoggerPro file. We set out the .40 M NiSO4 stock solution and the distilled water.
2. We set out the test tubes and used the pipet to add 2, 4, 6, and 8 mL of the stock solution into test tubes 1-4. Then we used the pipet to add 8, 6, 4, and 2 mL of distilled water into test tubes 1-4.
We kept the rest of the stock material in the beaker.
3. Next we calibrated the Colorimeter. We filled a cuvette 3/4 of the way full with distilled water. We put the cuvette into the colorimeter and used LoggerPro.
          -We chose Calibrate from the Experiment Menu. Selected One Point Calibration and then set the Colorimeter to the 0% T Position, typed 0 in the edit box and clicked "keep". We did the same thing at the Red LED position and typed 100 in the edit box and clicked "keep".
4. Then we clicked "Collect" on the graph and emptied the cuvette and added the solution from test tube 1 and put it into the Colorimeter. We waited for the absorbance valued to stabilize and then clicked "keep" and then typed .080. in the edit box.
5. We repeated Step 4 for Test Tubes 2-4. In the edit box for Test Tube 2 we typed .16, for test tube 3 we typed .24 and for test tube 4 we typed .32. We then recorded the stock solution. After we finished this we clicked "stop".
6. We used the Linear Regression button to see if there was a direct relationship between absorbance and concentration.
7. After that we used a cuvette and the colorimeter to record the unknown NiSO4 solution. We then recorded he absorbance value of the solution in this chart:


Why we did it:


This a picture of the Graph from the experiment. We used Interpolate from the Analyze menu to find the Concentration of the unknown solution by looking at the absorbance.
The Concentration of the unknown substance was .217 mol/L.

Monday, April 29, 2013

A Glogster Extravaganza (Presentation on Drug Resistance)

Recently we have been researching and compiling information on a subject of our choice. The point is to create a presentation that will present a problem, how it affects the world, and how it is being combatted.

Here is the link to my Glog!

Make sure to scroll over all of the text and graphics because there are hidden links connecting all of the Glogs together! Also, at the end of my presentation is my Work Cited, these were helpful websites when talking about drug resistance and compiling a presentation so I wanted to give direct links to a couple of them...

HERE

HERE

and HERE


Evaporation & Intermolecular Attractions

This is a link to the Prezi Des and I made for the Evaporation Lab we did earlier this year. I really enjoyed this lab and this Prezi does a good job of explaining what we did!

Prezi

Wednesday, March 13, 2013

Gas Laws

Recently we did some labs in Chemistry Class to learn about the Gas Laws:

Pressure vs. Volume:
Constant: Temperature
Boyle's Law
What We Did: For this experiment we wanted to test what happened to the volume of air in a syringe as we added more pressure to it. So we used the handy dandy chemistry book in Mr. Ludwig's classroom to add more pressure. As you can see, as we added more books the volume of air steadily went down. We started with 50 mL and by the time we ended the experiment with seven  books worth the pressure on the syringe we were down to 12 mL. Our experiment proves Boyle's Law which states that as Pressure goes up the Volume will go down.

 Pressure vs. Temperature:
Constant: Volume
Guy-Lussac's Law
What We Did:
In this lab we were trying to display what happens to the pressure of air in a syringe as the temperature surrounding the syringe increases or decreases. So we used a temperature probe to help keep track of the temps we were putting the syringe in. We tested the syringe in a hot but not too hot water, a hot water, ice and then also at room temperature. As you can see by the different points on the graph, the higher the temperature the higher the pressure of the air in the syringe. Our experiment therefore proves Guy-Lussac's Law, that as temperature goes up so does pressure.


Volume vs. Temperature:
Constant: Pressure
Charles Law
For some reason I do not have a graph for this part of the experiment but! I will do my best to explain what the point of it was. The point was to test how Volume reacts under different temperatures.But even though I don't have information on this part of the lab I can tell you that, Charles Law states that as Temperature goes up, Volume will also go up.

 I know this because...

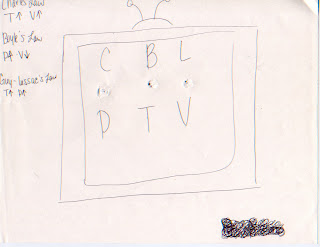
Below is an activity that Mr. Ludwig has us to do to learn more about the gas laws. If you look closely you can see the holes I poked through the paper. First, you stick your pencil through on of the holes. As you turn it, it will show you how Temp and Volume relate in Charles Law, Pressure and Volume relate in Boyle's Law and Temperature and Pressure relate in Guy-Lussac's Law.


Wednesday, February 6, 2013

Prezi!

So...a little while back we did a couple labs in Chemistry to learn more about hydrate formulas. The first lab involved some popcorn and the second involved some CuSo4. I did these labs with Morgan, Jocelyn, Destini, and Kelsey so we decided to collaborate on a Prezi together to talk about our labs! Here is the link to the Prezi:

Popcorn and Crystal Lab

Tuesday, February 5, 2013

Part 2: Empirical Formulas

In Chemistry we have been working on a couple different important concepts. I recently posted Part 1 on my blog which was a blog post about percent compositions which is a helpful skill on it's own. But! The next step is Empirical Formulas. And to be honest this is one of the most fun things I have done in Chemistry. Above is a flow chart that I made to explain how to solve an empirical formula from percent compositions. On the left side the chart describes the basic steps towards solving empirical formulas, and on the right side I work an example problem to further explain exactly how this process works! This will also be posted on my Pinterest Board which can be found here:

Sierra's Pinterest Board of Awesomeness!

:)


Monday, January 28, 2013

Shameless Plug...

So...about a week ago I came up with the idea to start a board on pinterest to include the things I have been learning in Chemistry. Right now we have been focusing a lot on the mole and how it relates with percent composition and formulas. I at first thought that I would only include that information on my Pinterest Board, but I have enjoyed it so much that I think I will continue to add to the board no matter what we are studying in Chemistry. I plan to pin some of my blog posts here...but also other things I make and find that relates to what we are studying. So here you go:

http://pinterest.com/sierra135/the-mole-chemistry/

This is the link to my Mole/Chemistry in general board on Pinterest! I hope to keep this board up for the rest of the year, and who knows? Maybe beyond ;) and add stuff that is helpful in gaining a greater understanding of what we are studying!

Enjoy!

Part 1: Percent Composition


Our Friend! The Periodic Table!
Over the past few weeks we have been focusing on some pretty big ideas. Above is a scanned image of the notes I took over three big concepts that we have been working on:
1. Percent Composition
2. Empirical Formulas
3. Molecular Formulas

First we worked on Percent Composition which is probably my favorite thing we have been doing. It takes some help from our friend the periodic table. Above on the left side of the scanned image of my notes you can see the formulas C5H8NO4. And you can see the rows of numbers below each letter. What does this mean? Well to find percent composition, we first need to look at the periodic table. C is the symbol for Carbon and when we look we see that the atomic mass is 12.011. In our formula there 5 Carbons. Sooooo...12x5 is 60. Then we do the same thing for the other symbols...Hydrogen has an atomic mass of 1.0079 (Hint: I round the numbers when I add them) so, 1x8 is 8. Then we move on to Nitrogen and Oxygen. At the end of it all, as you can see above, after we add together all our numbers we end up with 146. This is an important number because we need it to find the percent compositions of each Element in this formula. In the scanned image above I found the percent composition of Carbon in this formula. How did I do this? I divided the total mass of Carbon in this formula by the total mass of all of the elements. Which looks something like this: 60/146. Which is... .4109 and so on. Moving the decimal over we find that our percent composition of Carbon in this formula is 41.1%! This can be applied to any of the elements in the formula. For example the percent composition of Oxygen in the formula is 64/146 which comes out to .4383...43.8%!

Percent Composition is probably the most simple thing (to me anyway) that we have been working on. And I have really enjoyed working with problems to find Percent Composition!